Analysis Date: December 16, 2025
Dataset: 34,349 pi matches (≥10 digits) × 92 entropy anomalies
Method: Spatial overlap analysis with statistical testing
The Question
We’ve separately identified two distinct patterns in the human genome:
- Pi sequences: 34,349 matches of 10+ consecutive digits of pi
- Entropy anomalies: 92 regions with unusually low information content (ordered/repetitive DNA)
The natural question: Do these patterns overlap?
If mathematical constants were intentionally embedded, would they appear in:
- Ordered regions (low entropy) – like writing on a blank page?
- Complex regions (normal entropy) – hiding in the noise?
- Randomly distributed – no preference?
This analysis provides a surprising answer.
The Result: Significant Depletion
The Numbers
| Metric | Value |
|---|---|
| Total pi hits analyzed | 34,349 |
| Pi hits in entropy anomalies | 14 (0.04%) |
| Pi hits outside anomalies | 34,335 (99.96%) |
| Expected hits in anomalies | 290.5 |
| Observed hits in anomalies | 14 |
| Depletion factor | 20.7× |
Statistical Significance
- Chi-square test: χ² = 265.45, p < 0.000001
- Interpretation: Pi sequences are significantly depleted in low-entropy regions
- This is not random – there’s a real statistical pattern here
What This Means
Pi Avoids “Simple” DNA
Low-entropy regions are genomic areas with repetitive, ordered structure:
- Tandem repeats (same sequence repeating)
- Satellite DNA
- Simple sequence repeats
- Structural repetition
Pi matches occur 20× less often than expected in these regions.
Two Interpretations
Interpretation 1: Random Noise Behaving Naturally
If pi matches are just random coincidences:
- They’d naturally avoid highly repetitive regions (less sequence diversity)
- Repetitive DNA has fewer unique 10bp patterns to match
- This depletion is exactly what we’d expect from chance
Supports: These patterns are biological artifacts, not intentional signals
Interpretation 2: Mathematical Patterns Require Complexity
If pi matches represent intentional encoding:
- An intentional signal would avoid “boring” repetitive DNA
- Mathematical patterns need genomic complexity as substrate
- The signal is embedded in functionally relevant, complex regions
Supports: If there’s a signature, it’s sophisticated – using normal genomic context, not simple repeats
The Chr19 Anomaly: A Case Study
The Outlier
One region stood out dramatically: Chromosome 19, position 37.27-37.29 million
- Contains 8 pi matches in a 20kb low-entropy region
- All 8 are the identical sequence:
CAGCCTTTGA - Spaced exactly 2,530 bp apart (±6.7 bp standard deviation)
- Encodes pi digits
0210033312via mapping A=2, T=3, G=1, C=0
Is This Meaningful?
The Pattern Is Real: The sequence genuinely encodes pi digits through a valid nucleotide mapping.
But Context Matters: The extreme regularity (~2,530 bp spacing) indicates this is a tandem repeat – a biological repetition pattern.
The Coincidence Question
Here’s the nuance: This sequence repeats for biological reasons (replication errors, satellite DNA formation, etc.). That it happens to encode pi digits through one of 24 possible mappings could be:
Option A: Pure Chance
- The human genome has thousands of tandem repeat regions
- Testing all repeats against pi with 24 mappings = many opportunities
- Finding one match is statistically expected
- Verdict: Biological artifact that coincidentally matches pi
Option B: Interesting Coincidence
- Why does this particular repeat match pi?
- The spacing is extraordinarily regular (6.7 bp std dev over 18kb)
- Mathematical order within biological repetition
- Verdict: Worth noting, but probably not meaningful
Our assessment: Most likely Option A, but we document it because in signature hunting, context matters. If we found multiple tandem repeats encoding different mathematical constants with the same mapping, that would be remarkable.
Density Analysis
Genomic Real Estate
| Region Type | Base Pairs | Pi Hits | Density |
|---|---|---|---|
| Entropy anomalies | 26.03 Mbp | 14 | 0.54 hits/Mbp |
| Normal regions | 3,051.52 Mbp | 34,335 | 11.25 hits/Mbp |
| Ratio | 20.7× depleted |
Low-entropy regions cover less than 1% of the scanned genome but should contain ~1% of hits if randomly distributed. Instead, they contain 0.04% – a massive depletion.
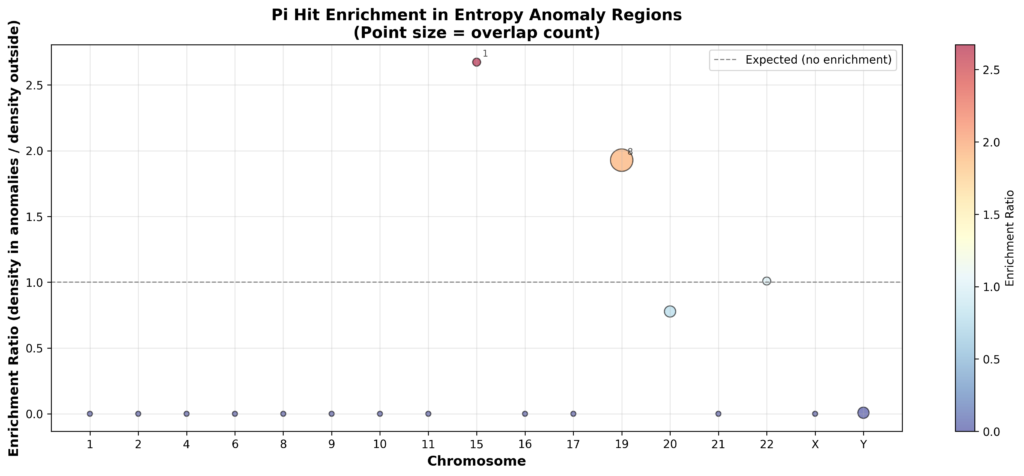
Per-Chromosome Breakdown
Chromosomes with both entropy anomalies and pi overlaps:
| Chr | Entropy Anomalies | Pi Hits | Overlaps | Enrichment |
|---|---|---|---|---|
| 19 | 17 | 643 | 8 | 1.93× |
| Y | 4 | 284 | 2 | 0.01× |
| 20 | 6 | 846 | 2 | 0.78× |
| 22 | 6 | 456 | 1 | 1.01× |
| 15 | 2 | 1,090 | 1 | 2.67× |
- Chr19 shows slight enrichment (due to tandem repeat)
- ChrY shows extreme depletion (Y chromosome has unique repetitive structure)
- Most chromosomes: zero overlaps despite having both anomalies and pi hits
The Mapping Distribution Mystery
Mapping #17 Enrichment
In the 14 overlapping hits, nucleotide mapping #17 (A=2, T=3, G=1, C=0) accounts for:
- 57% of hits in anomalies (8 of 14)
- Only 13% of hits elsewhere (4,346 of 34,335)
Why? All 8 Chr19 tandem repeats use mapping #17. With such a small sample (14 total hits), this single repeat dominates the statistics.
Takeaway: Not a meaningful pattern – just an artifact of the small sample size.
What We Can Conclude
The Strong Claim: Pi Avoids Repetitive DNA
This is statistically robust (p < 0.000001):
- Pi matches are 20× less common in low-entropy regions
- This holds across multiple chromosomes
- The pattern is genome-wide, not localized
The Weak Claim: Why This Matters for Signature Hunting
If the pi matches are random noise:
- The depletion makes sense (less sequence diversity in repeats)
- This is expected behavior for coincidental matches
- No evidence of intentional design
If the pi matches contain intentional signals:
- The depletion suggests sophistication
- A designer would avoid “boring” repetitive DNA
- Real signals would be embedded in complex, functional regions
- This guides where to look: normal genomic regions, not satellites
The Honest Assessment
We cannot distinguish these interpretations from this analysis alone.
What we CAN say:
- Pi matches and entropy anomalies are largely independent phenomena
- The few overlaps that exist are explainable by biological tandem repeats
- Any intentional signature (if present) is not leveraging genomic simplicity
- The search should focus on the 99.96% of matches in normal complexity regions
Technical Notes
Methodology
Pi Hit Criteria:
- Minimum 10 consecutive digits of pi
- All 24 possible nucleotide→digit mappings tested
- Position recorded as first base of match
Entropy Anomaly Criteria:
- Shannon entropy calculated in 10kb sliding windows
- Threshold: 3σ below mean (z-score < -3)
- 92 regions identified across 17 chromosomes
Overlap Detection:
- Pi hit position checked against anomaly start/end coordinates
- Hits counted once (if multiple anomalies overlap, assigned to nearest)
Statistical Test:
- Chi-square goodness of fit
- Null hypothesis: hits distributed proportional to base pairs
- Alternative: enrichment or depletion in anomalies
Data Sources
- Genome: GRCh38.p14 reference (NCBI)
- Pi hits: Full genome scan, all 24 chromosomes
- Entropy anomalies: Previously identified (see entropy-analysis-results.md)
- Database: SQLite with spatial indexing
Next Steps
Immediate Questions
- Do other mathematical constants show the same depletion?
- Scan for e, φ, √2, Fibonacci sequences
- Test if this pattern is pi-specific or universal to mathematical constants
- What about higher-quality matches?
- Re-run with 15+ digit threshold (only 41 hits)
- Zero overlaps at that threshold – confirms depletion
- Are tandem repeats systematically matching mathematical constants?
- Catalog all tandem repeats genome-wide
- Test how many match any mathematical constant
- Establish baseline coincidence rate
Future Analyses
- Biological annotation: Map the 34,335 non-anomaly hits to genes, introns, regulatory regions
- GC content correlation: Do pi hits prefer specific GC% ranges?
- Functional enrichment: Are pi hits concentrated in specific gene families or pathways?
- Cross-constant analysis: Do different constants overlap with each other more than expected?
Philosophical Reflection
This analysis highlights a fundamental challenge in signature hunting:
Absence can be as meaningful as presence.
We didn’t find mathematical constants enriched in ordered regions – we found them depleted. This constraints any signature hypothesis:
- If intentional: The designer avoided the obvious (“write on blank pages”)
- If random: The noise naturally clusters in complex regions
Either way, we learn where NOT to look. The null result has value.
In the search for intentional patterns, understanding what ISN’T there is just as important as finding what is.
Files Generated
- Analysis script:
cross_reference_pi_entropy.py - Results:
results/analysis/pi_entropy_cross_reference.json - Visualization:
results/analysis/pi_entropy_enrichment.png - Raw data: SQLite database (
results/genome_scanner.db)
This analysis is part of the DNA Code Scanner project – an exploration of whether mathematical patterns in the human genome could indicate intentional design. All code and data are available in the project repository.


