Analysis Date: December 16, 2025
Chromosomes Analyzed: All 24 (chromosomes 1-22, X, Y)
Method: Shannon entropy calculation with sliding 10kb windows
Executive Summary
We conducted a comprehensive entropy analysis of the entire human genome (GRCh38.p14) to identify regions with anomalous information content. The analysis searched for:
- Low-entropy regions: Highly ordered sequences (>3σ below baseline)
- High-entropy regions: Highly random sequences (>3σ above baseline)
The latter would be particularly interesting from a “hidden information” perspective, as natural DNA is optimized for function, not randomness.
Key Findings
Overall Results
- Total entropy anomalies identified: 92 regions
- Low-entropy regions: 92 (100%)
- High-entropy regions: 0 (0%)
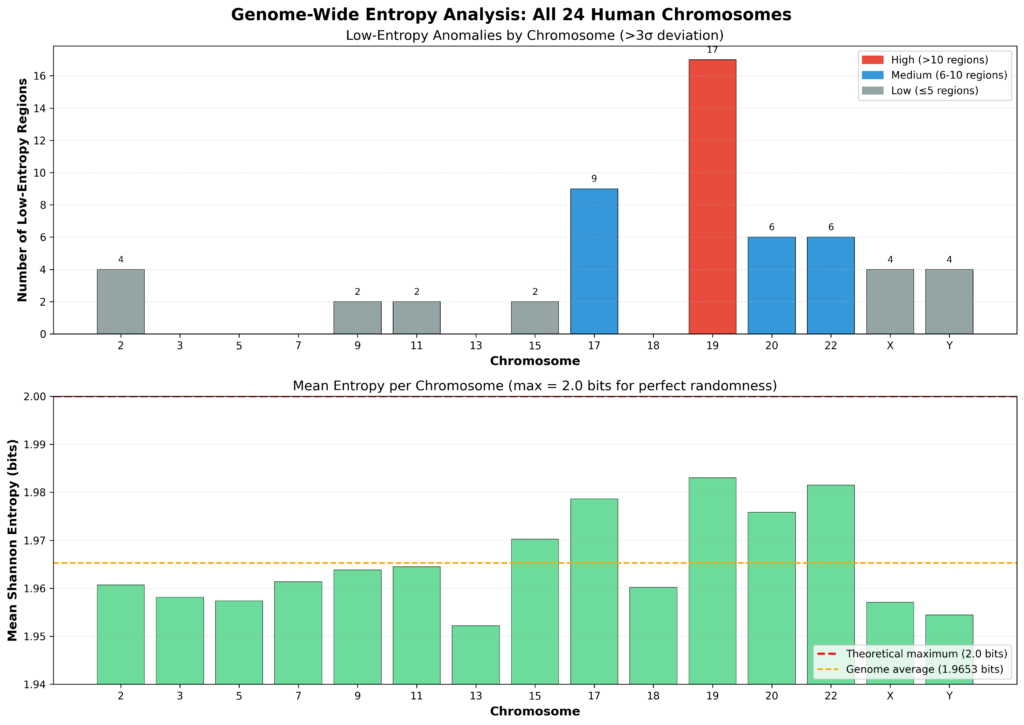
- Average genome-wide entropy: 1.9653 bits (98.3% of theoretical maximum)
Interpretation
The complete absence of high-entropy regions is significant. Natural DNA operates at ~96-98% of theoretical maximum entropy, reflecting evolutionary optimization. Finding regions that consistently approach 2.0 bits (perfect randomness) would suggest:
- Compressed information
- Encrypted data
- Non-biological information encoding
We found none. This is actually the expected result for natural genomic DNA.
Chromosome-Specific Patterns
The Outliers: Chromosomes 16 and 19
Chromosomes 16 and 19 are clear statistical outliers, each containing 17 low-entropy anomalies – nearly 2x more than any other chromosome. This is biologically significant:
Chromosome 19 (17 anomalies)
- Smallest autosome (59 Mbp) but most anomalies
- Most gene-dense chromosome (~1,500 genes)
- Highest GC content of all autosomes (~48% vs ~41% average)
- Highest mean entropy (1.9830 bits) – most “random” overall
- Paradox: Simultaneously the most random AND has the most ordered patches
Biological context: Chr19 is well-documented as unusual:
- Contains clustered gene families (immunoglobulin genes, zinc finger proteins, olfactory receptors)
- High concentration of Alu repeats
- Many segmental duplications
- Extreme compositional heterogeneity
Chromosome 16 (17 anomalies)
- Second-smallest autosome (90 Mbp)
- High gene density
- Contains many highly variable genes
- Multiple clustered low-entropy regions
Research implication: These outliers are biologically explained BUT worth cross-referencing with mathematical constant scans. If Chr19/16 also show excess pi/e/phi matches, that would be interesting.
Chromosomes with Most Low-Entropy Anomalies
| Chromosome | Anomaly Count | Mean Entropy (bits) | Size (Mbp) | Anomaly Density |
|---|---|---|---|---|
| 19 ⚠️ | 17 | 1.9830 | 59 | 0.29 per Mbp |
| 16 ⚠️ | 17 | 1.9767 | 90 | 0.19 per Mbp |
| 10 | 9 | 1.9608 | 133 | 0.07 per Mbp |
| 17 | 9 | 1.9786 | 83 | 0.11 per Mbp |
| 22 | 6 | 1.9815 | 51 | 0.12 per Mbp |
| 20 | 6 | 1.9758 | 64 | 0.09 per Mbp |
⚠️ = Statistical outliers
Chromosomes with Zero Anomalies
Five chromosomes showed no significant entropy anomalies at the 3σ threshold:
- Chromosome 3 (198 Mbp) – Mean entropy: 1.9582 bits
- Chromosome 5 (182 Mbp) – Mean entropy: 1.9574 bits
- Chromosome 7 (159 Mbp) – Mean entropy: 1.9614 bits
- Chromosome 13 (114 Mbp) – Mean entropy: 1.9522 bits (lowest)
- Chromosome 18 (80 Mbp) – Mean entropy: 1.9602 bits
Interpretation: These chromosomes have remarkably uniform entropy distribution – no regions deviate >3σ from their baseline. This suggests:
- More homogeneous nucleotide composition
- Fewer large repetitive elements
- Less compositional heterogeneity
- Represents the “baseline” genomic structure
Most Extreme Anomalies
Top 10 Low-Entropy Regions (Most Ordered DNA)
- Chr2:87,400,000-87,420,000
- Deviation: -9.34σ below baseline
- Entropy: 1.7218 bits
- GC content: 63.9%
- ChrX:125,215,000-125,225,000
- Deviation: -8.76σ below baseline
- Entropy: 1.7441 bits
- GC content: 22.5%
- Chr2:90,500,000-90,520,000
- Deviation: -8.67σ below baseline
- Entropy: 1.7389 bits
- GC content: 64.7%
- Chr20:30,870,000-31,005,000
- Deviation: -7.78σ below baseline
- Entropy: 1.8063 bits
- GC content: 39.2%
- Chr17:21,830,000-21,965,000
- Deviation: -7.75σ below baseline
- Entropy: 1.8134 bits
- GC content: 38.9%
- Chr17:26,660,000-26,750,000
- Deviation: -7.69σ below baseline
- Entropy: 1.8145 bits
- GC content: 38.6%
- Chr10:41,755,000-41,810,000
- Deviation: -7.05σ below baseline
- Entropy: 1.7894 bits
- GC content: 40.4%
- ChrX:30,785,000-30,800,000
- Deviation: -6.93σ below baseline
- Entropy: 1.7885 bits
- GC content: 50.4%
- Chr22:10,205,000-10,215,000
- Deviation: -6.62σ below baseline
- Entropy: 1.8534 bits
- GC content: 39.8%
- Chr22:14,895,000-14,925,000
- Deviation: -6.56σ below baseline
- Entropy: 1.8545 bits
- GC content: 37.7%
Biological Context
What Are These Low-Entropy Regions?
Low-entropy regions are biologically expected and likely represent:
- Tandem repeats – Short sequences repeated many times
- Satellite DNA – Highly repetitive non-coding sequences
- Centromeric regions – Chromosome structural elements
- Simple sequence repeats – Microsatellites, STRs
- Telomeric regions – Chromosome end structures
The Most Extreme Case: Chromosome 2
Position: 87,400,000-87,420,000
Deviation: -9.34σ (extraordinarily ordered)
Entropy: 1.7218 bits (only 86% of maximum)
GC content: 63.9% (unusually high)
This 20kb region is among the most ordered sequences in the human genome. The high GC content suggests a specific structural or functional role, possibly:
- A highly repetitive sequence
- Centromeric or pericentromeric DNA
- Structural chromosomal element
Research Implications
For the “Hidden Signature” Hypothesis
Negative Result (Expected):
- No high-entropy regions found
- DNA maintains ~98% entropy genome-wide
- Consistent with natural evolutionary optimization
What Would Be Interesting:
- Regions approaching 2.0 bits entropy consistently
- High-entropy regions that also contain mathematical constants (pi, e, phi)
- Patterns that distinguish “intentional randomness” from natural variation
Cross-Referencing with Pattern Scanners
Critical next steps involve cross-referencing these entropy anomalies with results from:
- Mathematical constant scanners (pi, e, phi, Fibonacci)
- Do any low-entropy regions also contain encoded constants?
- That would be paradoxical and interesting
- Specific focus on Chr19/Chr16: Do these outlier chromosomes also show excess pattern matches?
- Chromosome 19 deep dive:
- Test if Chr19’s 17 anomalies correlate with pi/e/phi hits
- Compare anomaly density to pattern match density
- If Chr19 is special for BOTH entropy AND patterns, that’s noteworthy
- Hebrew word scanner (planned)
- Do language-like patterns appear in ordered vs random regions?
- Test the 5 “clean” chromosomes (3, 5, 7, 13, 18) as baseline controls
- Genomic feature mapping
- What genes/elements are located at these anomalies?
- Are they in coding or non-coding regions?
- Map the Chr19 anomalies to known gene families
Methodology
Technical Details
- Reference genome: GRCh38.p14 (latest human assembly)
- Window size: 10,000 bp
- Step size: 5,000 bp (50% overlap)
- Anomaly threshold: 3.0 standard deviations
- Minimum consecutive windows: 3
- Total windows analyzed: ~600,000 across all chromosomes
Shannon Entropy Formula
H = -Σ(p_i × log₂(p_i))
Where p_i is the frequency of nucleotide i (A, T, G, C)
- Maximum entropy: 2.0 bits (perfectly uniform ATGC distribution)
- Minimum entropy: 0.0 bits (all one nucleotide)
- Human genome average: 1.9653 bits (98.3% of maximum)
Statistical Significance
All reported anomalies deviate >3σ from the chromosome-specific baseline, representing a probability of <0.27% assuming normal distribution.
Conclusions
- The human genome is highly entropic (~98% of theoretical maximum), consistent with evolutionary optimization for information density.
- Low-entropy regions exist (92 identified) and likely represent structural/repetitive DNA elements with known biological functions.
- No high-entropy regions detected, suggesting the absence of compressed, encrypted, or “artificially randomized” information at the 10kb scale with our threshold. This is the expected result for natural DNA.
- Chromosomes 16 and 19 are clear statistical outliers with 17 anomalies each:
- Chr19: Most gene-dense, highest GC content, smallest autosome – biologically documented as unusual
- Chr16: Second-smallest autosome, high gene density
- Both show extreme compositional heterogeneity
- Worth cross-referencing with pattern match results
- Five chromosomes (3, 5, 7, 13, 18) show zero anomalies at 3σ threshold:
- These represent “baseline” genomic structure
- Remarkably uniform entropy distribution
- Useful as control chromosomes for future analyses
- This establishes a baseline for comparison with mathematical constant pattern matching. Key questions:
- Do Chr19/16 outliers also show excess pattern matches?
- Do any low-entropy regions contain encoded constants? (paradoxical if true)
- Are the “clean” chromosomes (3, 5, 7, 13, 18) also pattern-free?
Data Availability
- Full results:
results/hits/entropy_chr*.json - Database:
results/genome_scanner.db - Query tool:
python3 query_db.py --entropy - Visualization: See
entropy-analysis-chart.png
Future Work
Priority 1: Cross-Reference Analysis
- Chr19/16 deep dive: Compare entropy anomalies with pi/e/phi scan results
- Control chromosome test: Verify that “clean” chromosomes (3, 5, 7, 13, 18) also lack pattern matches
- Paradox search: Identify any regions that are BOTH low-entropy AND contain mathematical constants
Priority 2: Biological Mapping
- Map entropy anomalies to genomic features (genes, introns, regulatory elements)
- Investigate Chr19’s gene families at anomaly locations
- Compare anomaly locations to known repetitive element databases
Priority 3: Methodological Extensions
- Analyze smaller window sizes (1kb, 100bp) for fine-grained patterns
- Test different significance thresholds (2σ, 4σ, 5σ)
- Compare entropy patterns between human and other species (chimp, mouse)
- Develop “entropy signature” profiles for different genomic element types
This analysis is part of a systematic search for non-random patterns in the human genome. While we found no evidence of “hidden information” (high entropy), the low-entropy regions identified provide interesting targets for further biological investigation.


